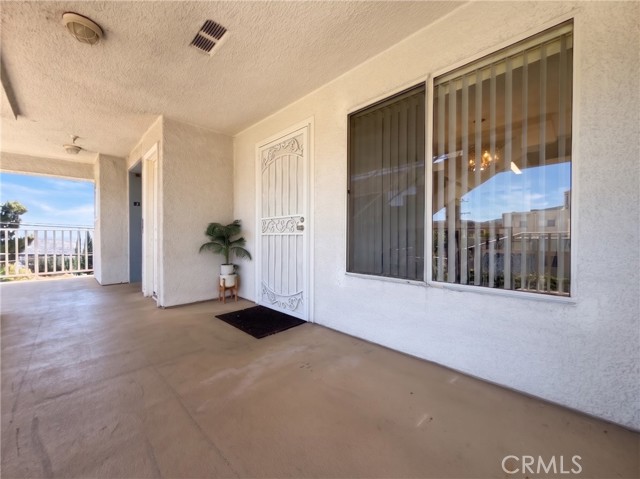
10282 Tujunga Canyon Boulevard, 201, Tujunga, CA 91042
10282 Tujunga Canyon Boulevard, 201, Tujunga, CA 91042
Property Description
Don't miss this beautiful 2 bedroom, 2 bathroom, single level condo in the heart of Tujunga! Enjoy elegant tile flooring in the main living area and lovely neighborhood views. The kitchen offers laminate counter tops and opens to the main living area. Both bedrooms feature large windows and ample storage space. The 2 bathrooms each offer tile floors, storage and a shower-in-tub. Additional property features include a balcony off of the living room, fire sprinklers, an inside laundry closet, and garage parking. Convenient to nearby schools, shopping plazas, and easy access to major freeways!
Features & Amenities
Property Details
Mortgage Calculator
Current Rates
Comparative Market Analysis
Affordable Tier · 2 active · 3 closed
Tujunga · Condominium
Listed 3.2% below the median closed sale of $516,500. Price per sqft ($492) is a 18% premium to closed comps ($418).
Price Position
Aligned with the market — fair pricing for the comps.
Active Properties (2)
Active Comparables
| Address | City | Year | BD | BTH | SqFt | LotSz | LP/SqFt | LP | DIM | Score |
|---|---|---|---|---|---|---|---|---|---|---|
| 10214 Samoa Avenue | Tujunga | 1980 | 2 | 3 | 1,198 | 39,069 | $417 | $499,000 | 97 | 76 |
| 10574 Sunland Boulevard | Sunland | 1979 | 2 | 2 | 1,072 | 374,619 | $465 | $499,000 | 16 | 73 |
| Total: 2 · Average | 2.0 | 2.5 | 1,135 | 206,844 | $441 | $499,000 | 56.5 | |||
| Median | 1,198 | $499,000 | ||||||||
Closed Properties (3)
Closed Comparables
| Address | City | Year | Date | BD | BTH | SqFt | LotSz | LP | SP | SP/SqFt | SP/LP | DIM | Score |
|---|---|---|---|---|---|---|---|---|---|---|---|---|---|
| 10219 Pinewood | Tujunga | 1980 | 05/29/2026 | 2 | 3 | 1,130 | 39,069 | $529,900 | $516,500 | $457 | 0.97 | 46 | 80 |
| 45 Parc Pl | Milpitas | 2005 | 08/25/2026 | 2 | 3 | 1,192 | 970 | $475,000 | $475,000 | $398 | 1.00 | 101 | 65 |
| 8720 Wyngate Street | Sunland | 1974 | 05/22/2026 | 3 | 2 | 1,428 | 359,702 | $570,000 | $570,000 | $399 | 1.00 | 100 | 58 |
| Total: 3 · Average | 2.3 | 2.7 | 1,250 | 133,247 | $520,500 | $520,500 | $418 | — | 82.33333333333333 | ||||
| Median | 1,192 | $516,500 | $516,500 | ||||||||||
Market Analysis
List vs Sale $/SqFt
Sale Price Trend
Days on Market
Sale vs List Price
This analysis was generated automatically from MLS data. For an in-depth, human-reviewed valuation, contact Joseph Sardella at josephsardella@gmail.com.