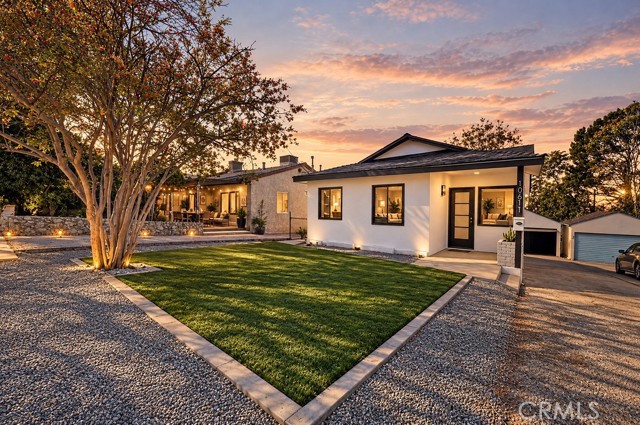
10611 Redmont, Tujunga, CA 91042
10611 Redmont, Tujunga, CA 91042
Property Description
Welcome to 10611 Redmont Ave - A Completely Remodeled, Move-In Ready Gem In the Heart of Tujunga! Beautifully remodeled from top to bottom, this stunning turnkey property offers the perfect combination of modern style, comfort and future potential. Thoughtfully upgraded throughout, this home is ready for its new owners to move right in and enjoy. Features include, open floor plan, brand new roof, new air conditioning system, re-designed kitchen, brand new appliances, fully remodeled bathroom, new flooring throughout, new landscaping and much much more! Whether you're a first time homebuyer or savvy investor, this property offers incredible value and exciting possibilities. An added highlight is the detached two car garage which can easily be converted to a potential ADU, offering the opportunity to create additional living space, generate rental income, or accommodate extended family. Hurry before it's gone!!!
Features & Amenities
Property Details
Mortgage Calculator
Current Rates
Comparative Market Analysis
Affordable Tier · 5 active · 5 closed
Tujunga · Single Family Residence
Listed in line with the median closed sale of $800,000. Price per sqft ($847) is a 26% premium to closed comps ($674).
Price Position
Aligned with the market — fair pricing for the comps.
Active Properties (5)
Active Comparables
| Address | City | Year | BD | BTH | SqFt | LotSz | LP/SqFt | LP | DIM | Score |
|---|---|---|---|---|---|---|---|---|---|---|
| 10512 Samoa Ave | Tujunga | 1945 | 3 | 1 | 1,003 | 5,637 | $872 | $874,999 | 81 | 86 |
| 7663 Airlie Drive | Tujunga | 1959 | 2 | 1 | 846 | 5,007 | $827 | $699,900 | 32 | 85 |
| 10610 Woodward | Sunland | 1928 | 2 | 1 | 936 | 7,159 | $849 | $795,000 | 94 | 81 |
| 11064 Plainview | Tujunga | 1923 | 2 | 1 | 872 | 8,648 | $974 | $849,000 | 250 | 78 |
| 10642 Mather Avenue | Sunland | 1964 | 3 | 2 | 1,154 | 4,480 | $685 | $789,999 | 4 | 72 |
| Total: 5 · Average | 2.4 | 1.2 | 962.2 | 6,186.2 | $841.4 | $801,779.6 | 92.2 | |||
| Median | 936 | $795,000 | ||||||||
Closed Properties (5)
Closed Comparables
| Address | City | Year | Date | BD | BTH | SqFt | LotSz | LP | SP | SP/SqFt | SP/LP | DIM | Score |
|---|---|---|---|---|---|---|---|---|---|---|---|---|---|
| 10563 Las Lunitas | Tujunga | 1940 | 08/18/2026 | 3 | 1 | 1,082 | 5,186 | $785,000 | $740,000 | $684 | 0.94 | 144 | 86 |
| 10603 Fernglen Avenue | Tujunga | 1950 | 07/13/2026 | 2 | 1 | 1,173 | 5,591 | $825,000 | $800,000 | $682 | 0.97 | 47 | 85 |
| 10642 Samoa Avenue | Tujunga | 1951 | 11/24/2025 | 2 | 1 | 1,171 | 5,880 | $689,000 | $760,000 | $649 | 1.10 | 62 | 80 |
| 10423 Mcclemont Avenue | Tujunga | 1953 | 11/05/2026 | 3 | 2 | 1,407 | 4,891 | $899,000 | $870,000 | $618 | 0.97 | 114 | 76 |
| 7072 Owens Street | Los Angeles | 1947 | 08/10/2026 | 3 | 1 | 1,125 | 15,436 | $829,900 | $830,000 | $738 | 1.00 | 116 | 76 |
| Total: 5 · Average | 2.6 | 1.2 | 1,191.6 | 7,396.8 | $800,000 | $800,000 | $674.2 | — | 96.6 | ||||
| Median | 1,171 | $800,000 | $800,000 | ||||||||||
Market Analysis
List vs Sale $/SqFt
Sale Price Trend
Days on Market
Sale vs List Price
This analysis was generated automatically from MLS data. For an in-depth, human-reviewed valuation, contact Joseph Sardella at josephsardella@gmail.com.