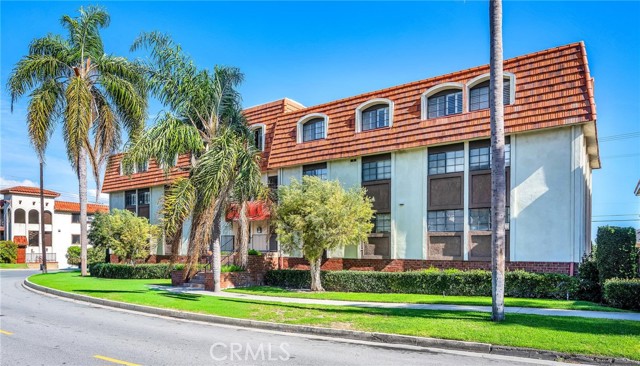
1110 South Leland Street, 104, San Pedro, CA 90731
1110 South Leland Street, 104, San Pedro, CA 90731
Property Description
House-sized living without the maintenance. Offering an exceptional 1,876 square feet, this expansive first-floor residence combines comfort, convenience, and extraordinary storage in a bright, move-in-ready setting. Freshly painted with stylish new laminate flooring throughout, the open floor plan features a formal dining room, a charming breakfast nook, and sun-filled living spaces enhanced by abundant windows. The kitchen is sure to impress with its oversized pantry and extensive cabinetry, while the spacious laundry room adds even more storage with additional cabinets and a folding station. Both bedrooms are generously sized and can easily accommodate a home office, reading area, or exercise space. For those concerned about storage, this home delivers in a way few condos can: two side-by-side parking spaces in a secure garage, storage lockers, and a substantial private walk-in storage room. If you're moving from a single-family home, you'll appreciate having room for everything without compromise.
Features & Amenities
Property Details
Mortgage Calculator
Current Rates
Comparative Market Analysis
Residential Tier · 5 active · 5 closed
San Pedro · Condominium
Listed 8.3% above the median closed sale of $600,000. Price per sqft ($346) is a 27% discount to closed comps ($476).
Price Position
Positioned above the market — commands a premium.
Active Properties (5)
Active Comparables
| Address | City | Year | BD | BTH | SqFt | LotSz | LP/SqFt | LP | DIM | Score |
|---|---|---|---|---|---|---|---|---|---|---|
| 1150 13th Street | San Pedro | 1981 | 2 | 3 | 1,852 | 28,776 | $335 | $620,000 | 62 | 89 |
| 926 Leland Street | San Pedro | 1992 | 3 | 2 | 1,672 | 5,824 | $388 | $649,000 | 20 | 88 |
| 441 2nd | Los Angeles | 1982 | 2 | 2 | 1,251 | 19,847 | $460 | $575,000 | 82 | 78 |
| 765 26th Street | San Pedro | 1976 | 2 | 2 | 1,114 | 36,216 | $498 | $555,000 | 47 | 76 |
| 2910 Peck | San Pedro | 1973 | 2 | 2 | 1,253 | 10,013 | $486 | $609,000 | 18 | 76 |
| Total: 5 · Average | 2.2 | 2.2 | 1,428.4 | 20,135.2 | $433.4 | $601,600 | 45.8 | |||
| Median | 1,253 | $609,000 | ||||||||
Closed Properties (5)
Closed Comparables
| Address | City | Year | Date | BD | BTH | SqFt | LotSz | LP | SP | SP/SqFt | SP/LP | DIM | Score |
|---|---|---|---|---|---|---|---|---|---|---|---|---|---|
| 1147 Leland Street | San Pedro | 1986 | 07/21/2026 | 2 | 2 | 1,098 | 11,552 | $585,000 | $600,000 | $546 | 1.03 | 54 | 84 |
| 1214 Alma Street | San Pedro | 1976 | 12/09/2025 | 2 | 2 | 1,318 | 13,310 | $589,900 | $570,000 | $432 | 0.97 | 50 | 82 |
| 1066 11th Street | Los Angeles | 1984 | 02/11/2026 | 2 | 2 | 1,196 | 5,402 | $630,000 | $625,000 | $523 | 0.99 | 26 | 82 |
| 912 11th | San Pedro | 1980 | 04/22/2026 | 2 | 2 | 1,183 | 10,507 | $580,000 | $580,000 | $490 | 1.00 | 77 | 80 |
| 2623 Lincoln Paseo | Ontario | 2026 | 07/15/2026 | 3 | 3 | 1,551 | 0 | $604,972 | $604,792 | $390 | 1.00 | 58 | 80 |
| Total: 5 · Average | 2.2 | 2.2 | 1,269.2 | 10,192.75 | $595,958.4 | $595,958.4 | $476.2 | — | 53 | ||||
| Median | 1,196 | $600,000 | $600,000 | ||||||||||
Market Analysis
List vs Sale $/SqFt
Sale Price Trend
Days on Market
Sale vs List Price
This analysis was generated automatically from MLS data. For an in-depth, human-reviewed valuation, contact Joseph Sardella at josephsardella@gmail.com.