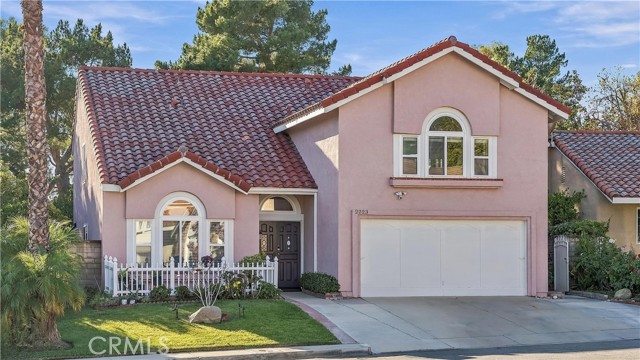
2223 Lobelia, Upland, CA 91784
2223 Lobelia, Upland, CA 91784
Property Description
Nestled in the beautiful city of Upland, just north of the 210 Freeway, this exceptional property offers a rare blend of natural beauty, tranquility, and convenience. Surrounded by lush greenery, mature trees, and vibrant flowers, the neighborhood is incredibly peaceful and picturesque. Enjoy breathtaking winter views of snow-capped mountains, creating a truly magical setting that feels like a hidden paradise. Ideally located with easy freeway access, excellent schools, and convenient access to shopping and everyday amenities, this home offers the perfect balance of serene living and modern convenience. A truly special and rare opportunity in a highly desirable location. Homes like this don't come along often. A must-see property—come experience its beauty and charm for yourself!
Features & Amenities
Property Details
Mortgage Calculator
Current Rates
Comparative Market Analysis
Residential Tier · 5 active · 5 closed
Upland · Single Family Residence
Listed 4.9% above the median closed sale of $1,030,000. Price per sqft ($370) is a 16% discount to closed comps ($441). Closed comps sold at 100% of list — strong seller's market.
Price Position
Aligned with the market — fair pricing for the comps.
Active Properties (5)
Active Comparables
| Address | City | Year | BD | BTH | SqFt | LotSz | LP/SqFt | LP | DIM | Score |
|---|---|---|---|---|---|---|---|---|---|---|
| 2184 Eiffel Circle | Upland | 1982 | 3 | 3 | 2,431 | 6,090 | $411 | $999,999 | 9 | 92 |
| 1539 Moonridge Court | Upland | 1988 | 3 | 3 | 1,885 | 8,400 | $488 | $919,900 | 41 | 82 |
| 1537 Grandview | Upland | 1988 | 4 | 3 | 2,722 | 11,590 | $363 | $988,800 | 37 | 78 |
| 1125 23rd | Upland | 1966 | 3 | 2 | 2,346 | 18,000 | $490 | $1.15M | 9 | 76 |
| 1140 22nd | Upland | 1981 | 4 | 3 | 2,446 | 16,016 | $503 | $1.23M | 255 | 73 |
| Total: 5 · Average | 3.4 | 2.8 | 2,366 | 12,019.2 | $451 | $1.06M | 70.2 | |||
| Median | 2,431 | $999,999 | ||||||||
Closed Properties (5)
Closed Comparables
| Address | City | Year | Date | BD | BTH | SqFt | LotSz | LP | SP | SP/SqFt | SP/LP | DIM | Score |
|---|---|---|---|---|---|---|---|---|---|---|---|---|---|
| 2253 Jasmine Avenue | Upland | 1987 | 10/05/2026 | 4 | 3 | 2,178 | 5,225 | $975,000 | $945,000 | $434 | 0.97 | 53 | 93 |
| 1427 Lookout Court | Upland | 1988 | 09/10/2026 | 5 | 3 | 2,755 | 7,800 | $1.04M | $1.11M | $403 | 1.07 | 35 | 89 |
| 1221 Hibiscus Street | Upland | 1986 | 01/02/2026 | 5 | 4 | 2,918 | 5,300 | $1.05M | $1.03M | $353 | 0.98 | 82 | 88 |
| 1175 Shane Court | Upland | 1983 | 06/04/2026 | 4 | 2 | 2,130 | 14,097 | $1.08M | $1.07M | $502 | 0.99 | 34 | 77 |
| 1256 Miller Court | Upland | 1988 | 12/23/2025 | 4 | 2 | 1,936 | 9,500 | $995,000 | $995,000 | $514 | 1.00 | 54 | 77 |
| Total: 5 · Average | 4.4 | 2.8 | 2,383.4 | 8,384.4 | $1.03M | $1.03M | $441.2 | — | 51.6 | ||||
| Median | 2,178 | $1.03M | $1.03M | ||||||||||
Market Analysis
List vs Sale $/SqFt
Sale Price Trend
Days on Market
Sale vs List Price
This analysis was generated automatically from MLS data. For an in-depth, human-reviewed valuation, contact Joseph Sardella at josephsardella@gmail.com.