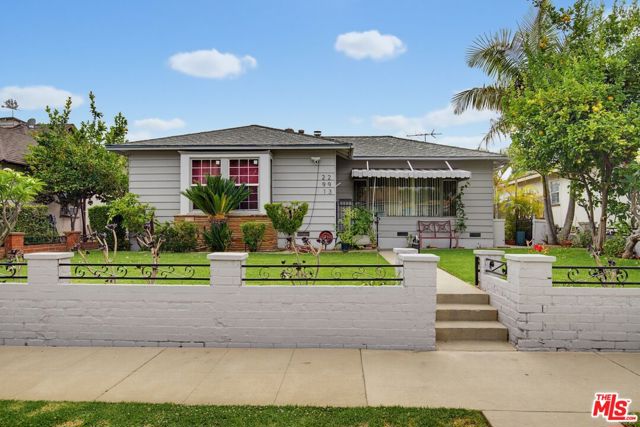
291 Simmons Avenue, Montebello, CA 90640
291 Simmons Avenue, Montebello, CA 90640
Property Description
First time on the market in 50+ years! Well-maintained duplex featuring two separate homes on one lot. Front house offers 3BD/2BA with living, dining and family rooms. Rear two-story home offers 2BD/1.5BA. Gated 3-car gated carport, detached 2-car garage with ADU potential (buyer to verify), shared courtyard, and tenants pay all utilities. Excellent East LA location bordering. Montebello near the 60 Freeway, Beverly Blvd and Monterey Park & East LA College. Pride of ownership throughout. Delivered with long-term tenants. Original house built in 1949, rear unit 1984. Rear unit is separate address, 293 Simmons (per Seller with permits)
Features & Amenities
Property Details
Mortgage Calculator
Current Rates
Comparative Market Analysis
Residential Tier · 5 active · 5 closed
Montebello · Single Family Residence
Listed 3.1% below the median closed sale of $1,135,000. Price per sqft ($388) is a 30% discount to closed comps ($555). Closed comps sold at 103% of list — strong seller's market.
Price Position
Aligned with the market — fair pricing for the comps.
Active Properties (5)
Active Comparables
| Address | City | Year | BD | BTH | SqFt | LotSz | LP/SqFt | LP | DIM | Score |
|---|---|---|---|---|---|---|---|---|---|---|
| 1732 Appian Way | Montebello | 1977 | 5 | 3 | 2,410 | 5,989 | $407 | $979,999 | 1 | 71 |
| 2308 Hendricks Avenue | Monterey Park | 1947 | 3 | 2 | 1,693 | 5,579 | $576 | $975,000 | 10 | 71 |
| 2009 Graylock Avenue | Monterey Park | 1949 | 3 | 3 | 1,698 | 5,982 | $618 | $1.05M | 48 | 70 |
| 2305 Schoolside | Monterey Park | 1948 | 4 | 2 | 1,768 | 7,861 | $564 | $998,000 | 28 | 69 |
| 2090 Brightwood | Monterey Park | 1957 | 4 | 2 | 2,032 | 6,127 | $603 | $1.23M | 10 | 69 |
| Total: 5 · Average | 3.8 | 2.4 | 1,920.2 | 6,307.6 | $553.6 | $1.05M | 19.4 | |||
| Median | 1,768 | $998,000 | ||||||||
Closed Properties (5)
Closed Comparables
| Address | City | Year | Date | BD | BTH | SqFt | LotSz | LP | SP | SP/SqFt | SP/LP | DIM | Score |
|---|---|---|---|---|---|---|---|---|---|---|---|---|---|
| 400 Hay Street | Montebello | 1948 | 09/18/2026 | 5 | 3 | 2,700 | 5,008 | $1.18M | $1.18M | $437 | 1.00 | 105 | 80 |
| 1630 Crest Vista Drive | Monterey Park | 1956 | 09/10/2026 | 4 | 3 | 2,137 | 6,446 | $1.05M | $1.05M | $491 | 1.00 | 93 | 74 |
| 211 Markland Drive | Monterey Park | 1951 | 07/10/2026 | 4 | 3 | 1,900 | 6,254 | $1.05M | $1.08M | $568 | 1.03 | 89 | 72 |
| 2024 Grandridge Ave | Monterey Park | 1949 | 06/12/2026 | 4 | 3 | 1,936 | 8,684 | $1.10M | $1.18M | $610 | 1.07 | 63 | 69 |
| 990 Moonbeam | Monterey Park | 1956 | 07/10/2026 | 3 | 2 | 1,700 | 6,782 | $1.07M | $1.14M | $668 | 1.06 | 51 | 65 |
| Total: 5 · Average | 4.0 | 2.8 | 2,074.6 | 6,634.8 | $1.12M | $1.12M | $554.8 | — | 80.2 | ||||
| Median | 1,936 | $1.14M | $1.14M | ||||||||||
Market Analysis
List vs Sale $/SqFt
Sale Price Trend
Days on Market
Sale vs List Price
This analysis was generated automatically from MLS data. For an in-depth, human-reviewed valuation, contact Joseph Sardella at josephsardella@gmail.com.