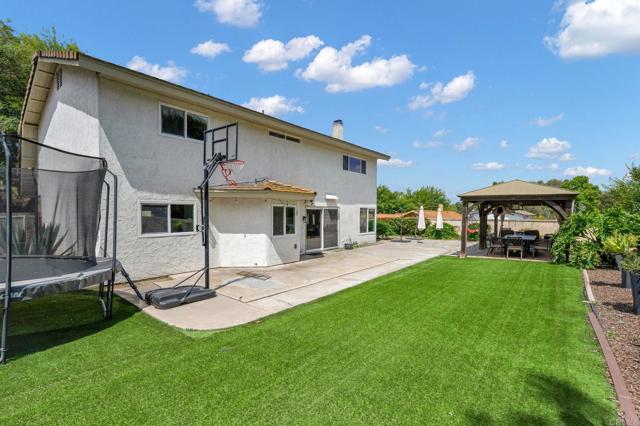
291 Surrey Place, Bonita, CA 91902
291 Surrey Place, Bonita, CA 91902
Property Description
Gorgeous executive 2900 SF home with 450sf bonus room that can be an ADU. Seller paid 2/1 buydown. Lower payments for 2 years! Gorgeous layout. 1 bed/bath down, primary & 3 up. Amazing entertainment area in backyard. Privacy, quiet, all the details you want in a home! Chefs kitchen, butlers pantry, large dining Room. Room in backyard for another ADU. SO much potential. Tour in person, it will amaze you. Wonderful neighborhood, well kept, quite & awesome neighbors. Everything you want, it's in this home!
Features & Amenities
Property Details
Mortgage Calculator
Current Rates
Comparative Market Analysis
Residential Tier · 5 active · 5 closed
Bonita · Single Family Residence
Listed 5.1% above the median closed sale of $1,270,000. Closed comps sold at 101% of list — strong seller's market.
Price Position
Positioned above the market — commands a premium.
Active Properties (5)
Active Comparables
| Address | City | Year | BD | BTH | SqFt | LotSz | LP/SqFt | LP | DIM | Score |
|---|---|---|---|---|---|---|---|---|---|---|
| 376 Camino Elevado | Bonita | 1978 | 4 | 2 | 1,903 | 8,276 | $657 | $1.25M | 20 | 76 |
| 779 Cholla Rd | Chula Vista | 1979 | 4 | 3 | 2,074 | 8,905 | $549 | $1.14M | 10 | 71 |
| 545 Canyon Drive | Bonita | 1989 | 3 | 3 | 1,916 | 10,890 | $600 | $1.15M | 2 | 68 |
| 5108 Senda Angosta Court | Bonita | 1978 | 5 | 3 | 2,352 | 23,100 | $594 | $1.40M | 33 | 66 |
| 3630 Bonita Glen Terrace | Bonita | 1970 | 4 | 2 | 1,932 | 10,940 | $655 | $1.26M | 10 | 65 |
| Total: 5 · Average | 4.0 | 2.6 | 2,035.4 | 12,422.2 | $611 | $1.24M | 15 | |||
| Median | 1,932 | $1.25M | ||||||||
Closed Properties (5)
Closed Comparables
| Address | City | Year | Date | BD | BTH | SqFt | LotSz | LP | SP | SP/SqFt | SP/LP | DIM | Score |
|---|---|---|---|---|---|---|---|---|---|---|---|---|---|
| 597 Parkside Drive | Chula Vista | 1992 | 09/28/2026 | 5 | 3 | 2,615 | 8,958 | $1.20M | $1.29M | $494 | 1.08 | 29 | 84 |
| 543 Beacon Place | Chula Vista | 1993 | 08/21/2026 | 5 | 3 | 3,133 | 12,537 | $1.27M | $1.27M | $405 | 1.00 | 20 | 81 |
| 1066 Surrey Drive | Bonita | 1983 | 06/30/2026 | 4 | 2 | 2,413 | 9,600 | $1.16M | $1.16M | $481 | 1.00 | 47 | 79 |
| 556 PADRONE PL | Chula Vista | 1996 | 07/17/2026 | 6 | 3 | 2,784 | 8,946 | $1.30M | $1.30M | $467 | 1.00 | 49 | 78 |
| 724 Del Corro Place | Chula Vista | 1993 | 10/01/2026 | 4 | 3 | 3,133 | 12,537 | $1.30M | $1.26M | $401 | 0.97 | 11 | 71 |
| Total: 5 · Average | 4.8 | 2.8 | 2,815.6 | 10,515.6 | $1.26M | $1.26M | $449.6 | — | 31.2 | ||||
| Median | 2,784 | $1.27M | $1.27M | ||||||||||
Market Analysis
List vs Sale $/SqFt
Sale Price Trend
Days on Market
Sale vs List Price
This analysis was generated automatically from MLS data. For an in-depth, human-reviewed valuation, contact Joseph Sardella at josephsardella@gmail.com.