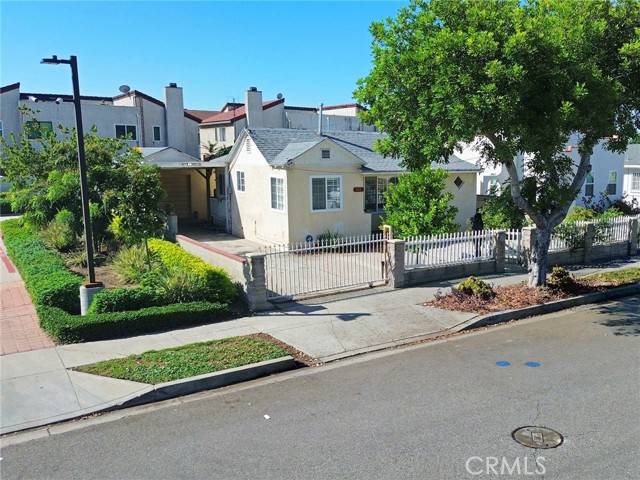
440 East Saxon Avenue, San Gabriel, CA 91776
440 East Saxon Avenue, San Gabriel, CA 91776
Property Description
Excellent opportunity for families and investors! This home needs a few small upgrades and a little bit of TLC. Situated on a 5,062 sq ft lot with 1,094 sq ft of living space and a detached 1-car garage, this sweet 3-bedroom, 2-bathroom home is more than ready for a new beginning and a loving family. The living room has laminate flooring. All bedrooms and bathrooms are generous in size. The carport offers extra shade on hot days. The detached garage has ADU potential that can add rental income for your family, subject to City of San Gabriel approval. Close to the 10 Fwy and other shopping centers. Come see! You won't be disappointed!
Features & Amenities
Property Details
Mortgage Calculator
Current Rates
Comparative Market Analysis
Affordable Tier · 5 active · 5 closed
San Gabriel · Single Family Residence
Listed in line with the median closed sale of $868,000. Price per sqft ($777) is a 18% premium to closed comps ($657). Closed comps sold at 100% of list — strong seller's market.
Price Position
Aligned with the market — fair pricing for the comps.
Active Properties (5)
Active Comparables
| Address | City | Year | BD | BTH | SqFt | LotSz | LP/SqFt | LP | DIM | Score |
|---|---|---|---|---|---|---|---|---|---|---|
| 7822 Artson Street | Rosemead | 1962 | 3 | 2 | 1,192 | 6,231 | $653 | $778,000 | 69 | 85 |
| 8653 Norwood Place | Rosemead | 1957 | 3 | 2 | 1,260 | 5,421 | $713 | $898,000 | 61 | 81 |
| 2560 Falling Leaf | Rosemead | 1939 | 2 | 2 | 960 | 4,791 | $911 | $875,000 | 34 | 80 |
| 903 Wells Street | San Gabriel | 1941 | 3 | 2 | 1,392 | 5,407 | $646 | $899,000 | 52 | 80 |
| 3919 Gernert Avenue | Rosemead | 1949 | 2 | 1 | 1,188 | 8,965 | $663 | $788,000 | 14 | 77 |
| Total: 5 · Average | 2.6 | 1.8 | 1,198.4 | 6,163 | $717.2 | $847,600 | 46 | |||
| Median | 1,192 | $875,000 | ||||||||
Closed Properties (5)
Closed Comparables
| Address | City | Year | Date | BD | BTH | SqFt | LotSz | LP | SP | SP/SqFt | SP/LP | DIM | Score |
|---|---|---|---|---|---|---|---|---|---|---|---|---|---|
| 1973 Twin Ave | San Gabriel | 1941 | 05/22/2026 | 3 | 2 | 1,036 | 6,102 | $850,000 | $868,000 | $838 | 1.02 | 45 | 87 |
| 2027 California Street | San Gabriel | 1925 | 09/29/2026 | 3 | 2 | 1,128 | 6,075 | $760,000 | $745,000 | $660 | 0.98 | 78 | 85 |
| 1977 California Street | San Gabriel | 1940 | 07/01/2026 | 2 | 1 | 1,411 | 6,369 | $839,000 | $850,000 | $602 | 1.01 | 166 | 83 |
| 135 Marshall | San Gabriel | 1931 | 10/30/2026 | 2 | 2 | 1,334 | 7,216 | $899,000 | $905,000 | $678 | 1.01 | 32 | 79 |
| 888 Olney Street | San Gabriel | 1941 | 06/11/2026 | 3 | 2 | 1,858 | 5,893 | $938,000 | $938,000 | $505 | 1.00 | 142 | 66 |
| Total: 5 · Average | 2.6 | 1.8 | 1,353.4 | 6,331 | $861,200 | $861,200 | $656.6 | — | 92.6 | ||||
| Median | 1,334 | $868,000 | $868,000 | ||||||||||
Market Analysis
List vs Sale $/SqFt
Sale Price Trend
Days on Market
Sale vs List Price
This analysis was generated automatically from MLS data. For an in-depth, human-reviewed valuation, contact Joseph Sardella at josephsardella@gmail.com.