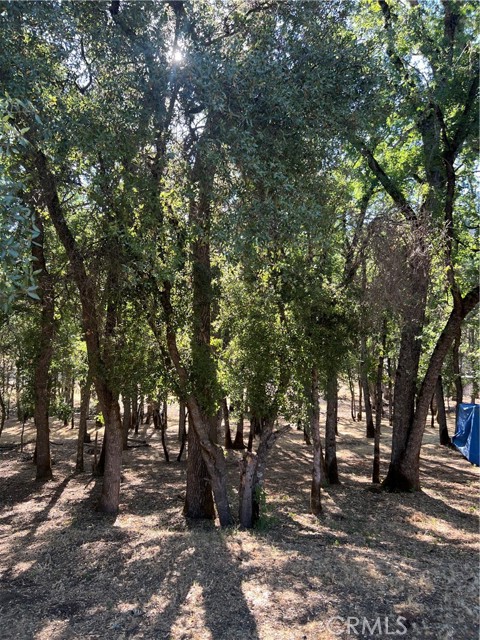
5723 Inca Way, Kelseyville, CA 95451
5723 Inca Way, Kelseyville, CA 95451
Property Description
Seculded gem on private lane...This cozy 3-bedroom home is move-in ready and can serve as your primary residence, as rental property, or guest house while you build your main residence. Explore the possibilities of acquiring four contiguous lots, located in prime area. Conduct your own due diligence with local planning department to build custom homes for your family and rental income.
Features & Amenities
Property Details
Mortgage Calculator
Current Rates
Comparative Market Analysis
Affordable Tier · 5 active · 5 closed
Kelseyville · Single Family Residence
Listed 13.6% above the median closed sale of $330,000. Price per sqft ($312) is a 17% premium to closed comps ($267). Closed comps sold at 100% of list — strong seller's market. Expect a longer timeline — comps averaged 134 days on market.
Price Position
Positioned above the market — commands a premium.
Active Properties (5)
Active Comparables
| Address | City | Year | BD | BTH | SqFt | LotSz | LP/SqFt | LP | DIM | Score |
|---|---|---|---|---|---|---|---|---|---|---|
| 9815 Siskiyou Court | Kelseyville | 1988 | 3 | 2 | 1,112 | 8,276 | $296 | $329,000 | 58 | 86 |
| 9995 Monte Cristo Drive | Kelseyville | 1992 | 3 | 2 | 1,348 | 6,534 | $251 | $339,000 | 166 | 85 |
| 5443 Olympia Drive | Kelseyville | 1991 | 3 | 2 | 1,280 | 10,890 | $292 | $374,000 | 383 | 84 |
| 10306 Del Monte Way | Kelseyville | 2001 | 3 | 2 | 1,116 | 6,970 | $296 | $330,000 | 67 | 84 |
| 9620 Tenaya | Kelseyville | 2002 | 4 | 3 | 1,430 | 7,405 | $238 | $340,000 | 43 | 83 |
| Total: 5 · Average | 3.2 | 2.2 | 1,257.2 | 8,015 | $274.6 | $342,400 | 143.4 | |||
| Median | 1,280 | $339,000 | ||||||||
Closed Properties (5)
Closed Comparables
| Address | City | Year | Date | BD | BTH | SqFt | LotSz | LP | SP | SP/SqFt | SP/LP | DIM | Score |
|---|---|---|---|---|---|---|---|---|---|---|---|---|---|
| 5248 Tewa Court | Kelseyville | 2006 | 08/14/2026 | 3 | 2 | 1,324 | 8,276 | $360,000 | $360,000 | $272 | 1.00 | 95 | 85 |
| 9320 Paloos Court | Kelseyville | 2006 | 08/28/2026 | 3 | 2 | 1,341 | 7,841 | $329,000 | $329,009 | $245 | 1.00 | 175 | 81 |
| 9421 Fairway Drive | Kelseyville | 2004 | 04/27/2026 | 3 | 2 | 1,264 | 6,534 | $314,900 | $325,000 | $257 | 1.03 | 336 | 81 |
| 10305 Hok Has Ha | Kelseyville | 1983 | 01/30/2026 | 3 | 2 | 1,300 | 8,276 | $349,000 | $340,000 | $262 | 0.97 | 16 | 78 |
| 9629 Fairway | Kelseyville | 1979 | 01/26/2026 | 2 | 1 | 1,111 | 6,098 | $330,000 | $330,000 | $297 | 1.00 | 48 | 77 |
| Total: 5 · Average | 2.8 | 1.8 | 1,268 | 7,405 | $336,801.8 | $336,801.8 | $266.6 | — | 134 | ||||
| Median | 1,300 | $330,000 | $330,000 | ||||||||||
Market Analysis
List vs Sale $/SqFt
Sale Price Trend
Days on Market
Sale vs List Price
This analysis was generated automatically from MLS data. For an in-depth, human-reviewed valuation, contact Joseph Sardella at josephsardella@gmail.com.