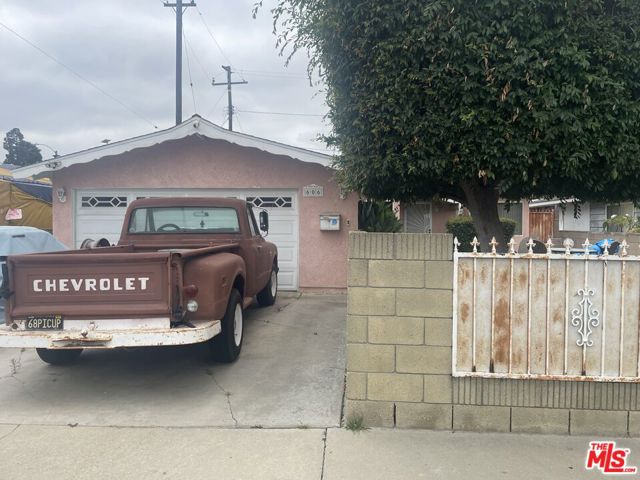
606 West Galavan Street, Carson, CA 90745
606 West Galavan Street, Carson, CA 90745
Property Description
Don't miss the opportunity to own this single-family residence in one of the area's most connected locations! This home features 1,250 square feet of living space, 3 bedrooms, 2 bathrooms, and plenty of space for incredible possibilities! For those with a vision, this property is a canvas with boundless potential. Whether you're looking to create your dream home or explore investment opportunities, this home provides a flexible layout, making this an exceptional opportunity to add value and capitalize on your investment. Conveniently located with easy access to major freeways, Downtown Los Angeles, the harbor, local beaches, and the South Bay lifestyle, South Carson continues to attract attention for its accessibility, established neighborhoods, and value.
Features & Amenities
Property Details
Mortgage Calculator
Current Rates
Comparative Market Analysis
Affordable Tier · 5 active · 5 closed
Carson · Single Family Residence
Listed 7.0% below the median closed sale of $730,000. Price per sqft ($543) is a 19% discount to closed comps ($673). Closed comps sold at 102% of list — strong seller's market.
Price Position
Priced below the market — value advantage over the field.
Active Properties (5)
Active Comparables
| Address | City | Year | BD | BTH | SqFt | LotSz | LP/SqFt | LP | DIM | Score |
|---|---|---|---|---|---|---|---|---|---|---|
| 22620 Menlo | Torrance | 1954 | 3 | 2 | 1,267 | 3,844 | $591 | $749,000 | 54 | 90 |
| 322 226th Street | Carson | 1954 | 4 | 2 | 1,401 | 5,671 | $442 | $619,000 | 11 | 86 |
| 139 229th Street | Carson | 1951 | 3 | 1 | 1,034 | 6,706 | $667 | $690,000 | 3 | 79 |
| 22443 Meyler Street | Torrance | 1927 | 3 | 2 | 1,487 | 5,063 | $518 | $771,000 | 97 | 76 |
| 1001 Jay | Torrance | 1954 | 2 | 1 | 812 | 5,455 | $831 | $674,900 | 16 | 74 |
| Total: 5 · Average | 3.0 | 1.6 | 1,200.2 | 5,347.8 | $609.8 | $700,780 | 36.2 | |||
| Median | 1,267 | $690,000 | ||||||||
Closed Properties (5)
Closed Comparables
| Address | City | Year | Date | BD | BTH | SqFt | LotSz | LP | SP | SP/SqFt | SP/LP | DIM | Score |
|---|---|---|---|---|---|---|---|---|---|---|---|---|---|
| 626 Martinshire | Carson | 1955 | 07/21/2026 | 3 | 2 | 1,174 | 4,894 | $750,000 | $760,000 | $647 | 1.01 | 106 | 92 |
| 23045 Delford Avenue | Carson | 1967 | 07/17/2026 | 3 | 2 | 1,316 | 4,576 | $700,000 | $718,000 | $546 | 1.03 | 15 | 87 |
| 419 Martinshire | Carson | 1957 | 01/16/2026 | 3 | 2 | 1,237 | 5,479 | $740,000 | $780,000 | $631 | 1.05 | 31 | 87 |
| 22832 Menlo | Torrance | 1953 | 06/02/2026 | 3 | 2 | 910 | 5,097 | $699,900 | $725,000 | $797 | 1.04 | 85 | 86 |
| 173 232nd Pl | Carson | 1952 | 07/10/2026 | 3 | 2 | 982 | 5,761 | $749,999 | $730,000 | $743 | 0.97 | 43 | 86 |
| Total: 5 · Average | 3.0 | 2.0 | 1,123.8 | 5,161.4 | $742,600 | $742,600 | $672.8 | — | 56 | ||||
| Median | 1,174 | $730,000 | $730,000 | ||||||||||
Market Analysis
List vs Sale $/SqFt
Sale Price Trend
Days on Market
Sale vs List Price
This analysis was generated automatically from MLS data. For an in-depth, human-reviewed valuation, contact Joseph Sardella at josephsardella@gmail.com.