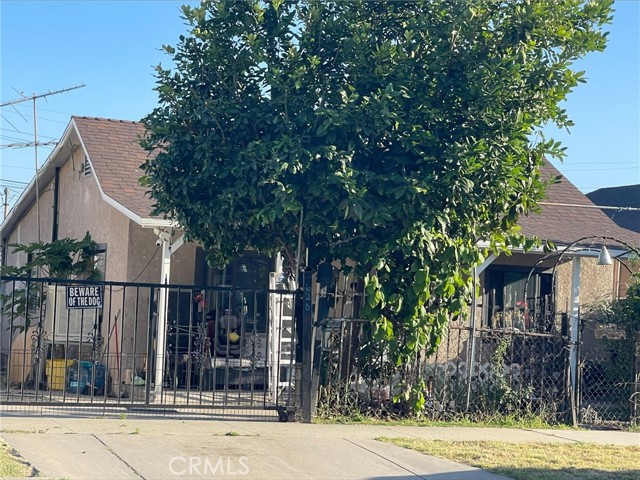
1 / 2
628 East Maitland, Ontario, CA 91761
$580K3bd · 1ba · 832 sqft
Lot 6,080 sqft•Single Family Residence•Active•125d on market•MLS# IV-26124086
628 East Maitland, Ontario, CA 91761
MLS# IV-26124086•Residential•Single Family Residence
Active125 days on market
$579,800
3
Beds
1
Baths
832
Sq Ft
6,080
Lot Sq Ft
1937
Year Built
None
View
Property Description
location, great for commuters, great for first time buyers and or season investors, close to schools, shopping centers, and freeways. don't let a good deal pass you buy. call today to schedule your first showing
Features & Amenities
FeeBuilt 1937
Property Details
Land Type
Fee
Year Built
1937
Property Type
Residential
Property Subtype
Single Family Residence
Parking Spaces
0
Garage Spaces
0
Heating
Wall Furnace
Cooling
None
View
None
City
Ontario
Zip Code
91761
County
San Bernardino
Mortgage Calculator
Current Rates
$
$
%
Monthly Payment
$2,931.78
Principal & Interest
Loan Amount
$463,840
Total Interest
$591,602
Total Payment Over 30 Years
$1,055,442
This calculator provides estimates only. Actual mortgage payments may include taxes, insurance, HOA fees, and PMI. Contact a lender for accurate quotes.
Comparative Market Analysis
Affordable Tier · 5 active · 5 closed
628 East Maitland, Ontario, CA 91761
Ontario · Single Family Residence
$580K
Affordable TierBeds
3
Baths
1
Sqft
832
Lot
6,080 sqft
Year
1937
$/Sqft
$697
Pool: No✓
View: None✓
Listed 10.4% above the median closed sale of $525,000. Price per sqft ($697) is a 11% premium to closed comps ($630). Closed comps sold at 109% of list — strong seller's market.
Price Position
Positioned above the market — commands a premium.
Premium
Subject listed at $580K· $697/sqft
Total list price
Closed comps
vs closed median $525K
+$55K (+10.4%)
Active comps
vs active median $590K
−$10K (−1.7%)
Price per sqft
Closed compsinsufficient comp data
Active comps
vs active avg $/sqft $659
+$38 (+5.8%)
Active Properties (5)
Active Comparables
| Address | City | Year | BD | BTH | SqFt | LotSz | LP/SqFt | LP | DIM | Score |
|---|---|---|---|---|---|---|---|---|---|---|
| 1214 Sultana | Ontario | 1952 | 3 | 3 | 872 | 5,356 | $682 | $595,000 | 102 | 85 |
| 301 Nevada | Ontario | 1915 | 2 | 1 | 867 | 7,350 | $727 | $629,900 | 8 | 83 |
| 122 De Anza Circle | Ontario | 1953 | 3 | 1 | 990 | 6,750 | $596 | $589,900 | 45 | 83 |
| 966 Elma Street | Ontario | 1921 | 3 | 1 | 875 | 5,227 | $662 | $579,000 | 39 | 81 |
| 909 I Street | Ontario | 1944 | 2 | 1 | 924 | 4,263 | $628 | $580,000 | 95 | 78 |
| Total: 5 · Average | 2.6 | 1.4 | 905.6 | 5,789.2 | $659 | $594,760 | 57.8 | |||
| Median | 875 | $589,900 | ||||||||
Closed Properties (5)
Closed Comparables
| Address | City | Year | Date | BD | BTH | SqFt | LotSz | LP | SP | SP/SqFt | SP/LP | DIM | Score |
|---|---|---|---|---|---|---|---|---|---|---|---|---|---|
| 548 State Street | Ontario | 1905 | 12/05/2025 | 2 | 1 | 738 | 6,185 | $499,999 | $525,000 | $711 | 1.05 | 58 | 77 |
| 1107 Greenwood Avenue | Ontario | 1955 | 12/12/2025 | 2 | 1 | 696 | 6,500 | $525,000 | $525,000 | $754 | 1.00 | 128 | 76 |
| 1004 California | Ontario | 1950 | 01/29/2026 | 1 | 1 | 624 | 12,740 | $499,999 | $520,000 | $833 | 1.04 | 48 | 69 |
| 402 Phillips Street | Ontario | 1956 | 02/12/2026 | 3 | 2 | 1,168 | 13,100 | $560,000 | $600,000 | $514 | 1.07 | 36 | 66 |
| 902 Hope Avenue | Ontario | 1946 | 02/23/2026 | 3 | 2 | 1,507 | 5,396 | $399,999 | $510,000 | $338 | 1.27 | 32 | 65 |
| Total: 5 · Average | 2.2 | 1.4 | 946.6 | 8,784.2 | $536,000 | $536,000 | $630 | — | 60.4 | ||||
| Median | 738 | $525,000 | $525,000 | ||||||||||
Market Analysis
List vs Sale $/SqFt
Sale Price Trend
Days on Market
Sale vs List Price
AI-generated CMA
This analysis was generated automatically from MLS data. For an in-depth, human-reviewed valuation, contact Joseph Sardella at josephsardella@gmail.com.