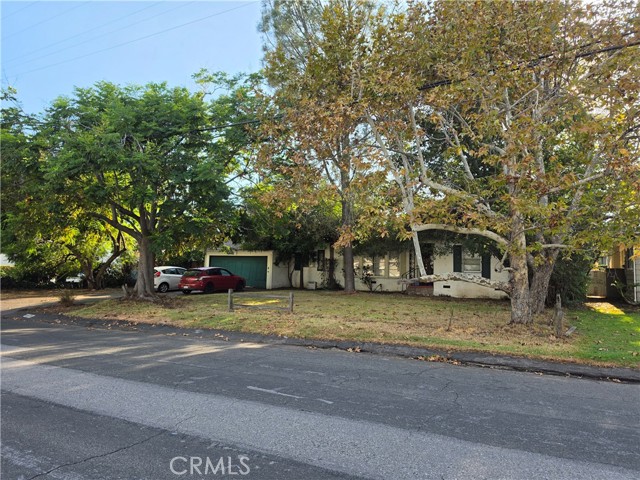
1 / 1
6575 North Vista, San Gabriel, CA 91775
$1.29M4bd · 2ba · 1,954 sqft
Lot 10,094 sqft•Single Family Residence•Active•14d on market•MLS# WS-26205332
6575 North Vista, San Gabriel, CA 91775
MLS# WS-26205332•Residential•Single Family Residence
Active14 days on market
$1,290,000
4
Beds
2
Baths
1,954
Sq Ft
10,094
Lot Sq Ft
1947
Year Built
None
View
Property Description
Investor/Contractor special in North San Gabriel. Property needs TLC. Sold AS-IS condition. Bit Lot size: 10,094 S/F. Private back yard. lots of fruit trees around. Convenient location. Cash offer only.
Features & Amenities
FeeBuilt 1947
Property Details
Land Type
Fee
Year Built
1947
Property Type
Residential
Property Subtype
Single Family Residence
Parking Spaces
2
Garage Spaces
2
Cooling
Central Air
View
None
City
San Gabriel
Zip Code
91775
County
Los Angeles
Mortgage Calculator
Current Rates
$
$
%
Monthly Payment
$6,522.94
Principal & Interest
Loan Amount
$1,032,000
Total Interest
$1,316,259
Total Payment Over 30 Years
$2,348,259
This calculator provides estimates only. Actual mortgage payments may include taxes, insurance, HOA fees, and PMI. Contact a lender for accurate quotes.
Comparative Market Analysis
Residential Tier · 5 active · 5 closed
6575 North Vista, San Gabriel, CA 91775
San Gabriel · Single Family Residence
$1.29M
Residential TierBeds
4
Baths
2
Sqft
1,954
Lot
10,094 sqft
Year
1947
$/Sqft
$660
Pool: No✓
View: None✓
Garage: 2-car✓
Listed 4.3% below the median closed sale of $1,348,500. Price per sqft ($660) is a 12% discount to closed comps ($747). Closed comps sold at 103% of list — strong seller's market.
Price Position
Aligned with the market — fair pricing for the comps.
At market
Subject listed at $1.29M· $660/sqft
Total list price
Closed comps
vs closed median $1.35M
−$59K (−4.3%)
Active comps
vs active median $1.48M
−$185K (−12.5%)
Price per sqft
Closed compsinsufficient comp data
Active comps
vs active avg $/sqft $775
−$115 (−14.8%)
Active Properties (5)
Active Comparables
| Address | City | Year | BD | BTH | SqFt | LotSz | LP/SqFt | LP | DIM | Score |
|---|---|---|---|---|---|---|---|---|---|---|
| 8605 Longden Avenue | San Gabriel | 1965 | 4 | 2 | 1,803 | 6,452 | $608 | $1.10M | 64 | 87 |
| 6522 Oak Avenue | Temple City | 1953 | 3 | 2 | 1,803 | 6,227 | $660 | $1.19M | 46 | 82 |
| 405 Del Mar Avenue | San Gabriel | 1940 | 3 | 2 | 1,556 | 9,000 | $951 | $1.48M | 45 | 80 |
| 225 Segovia | San Gabriel | 1926 | 4 | 2 | 1,793 | 6,256 | $823 | $1.48M | 3 | 79 |
| 5611 Noel Drive | Temple City | 1952 | 3 | 2 | 1,770 | 7,141 | $833 | $1.48M | 113 | 78 |
| Total: 5 · Average | 3.4 | 2.0 | 1,745 | 7,015.2 | $775 | $1.34M | 54.2 | |||
| Median | 1,793 | $1.48M | ||||||||
Closed Properties (5)
Closed Comparables
| Address | City | Year | Date | BD | BTH | SqFt | LotSz | LP | SP | SP/SqFt | SP/LP | DIM | Score |
|---|---|---|---|---|---|---|---|---|---|---|---|---|---|
| 6264 Bion | San Gabriel | 1947 | 09/08/2026 | 3 | 2 | 1,850 | 8,000 | $1.09M | $1.14M | $614 | 1.04 | 22 | 90 |
| 6839 Rockhold Ave | San Gabriel | 1948 | 10/01/2026 | 3 | 2 | 1,626 | 8,850 | $1.35M | $1.40M | $861 | 1.04 | 51 | 89 |
| 6767 Ruthlee | San Gabriel | 1948 | 04/02/2026 | 3 | 2 | 1,718 | 9,015 | $1.19M | $1.30M | $757 | 1.09 | 64 | 88 |
| 6552 Vista Street | San Gabriel | 1948 | 05/06/2026 | 4 | 3 | 2,278 | 7,208 | $1.40M | $1.40M | $614 | 1.00 | 47 | 88 |
| 8350 Duarte | San Gabriel | 1954 | 06/11/2026 | 3 | 2 | 1,516 | 8,635 | $1.35M | $1.35M | $890 | 1.00 | 42 | 87 |
| Total: 5 · Average | 3.2 | 2.2 | 1,797.6 | 8,341.6 | $1.32M | $1.32M | $747.2 | — | 45.2 | ||||
| Median | 1,718 | $1.35M | $1.35M | ||||||||||
Market Analysis
List vs Sale $/SqFt
Sale Price Trend
Days on Market
Sale vs List Price
AI-generated CMA
This analysis was generated automatically from MLS data. For an in-depth, human-reviewed valuation, contact Joseph Sardella at josephsardella@gmail.com.