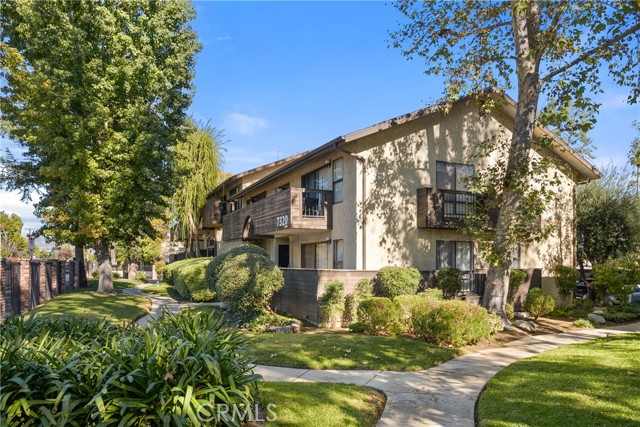
7320 Corbin Ave, M, Reseda, CA 91335
7320 Corbin Ave, M, Reseda, CA 91335
Property Description
This clean, second-floor end unit is the only condo currently available in Peppertree, a well-maintained gated community with mature landscaping and resort-style amenities. Enjoy a gated pool area with a separate spa, a full-size tennis court, and a fenced dog area. The condo includes a detached two-car garage, and the community offers ample guest parking. With shops nearby and the freeway just a short drive away, this inviting condo is a great opportunity for first-time buyers.
Features & Amenities
Property Details
Mortgage Calculator
Current Rates
Comparative Market Analysis
Affordable Tier · 5 active · 5 closed
Reseda · Condominium
Listed 5.0% above the median closed sale of $380,000. Price per sqft ($488) is a 23% premium to closed comps ($398).
Price Position
Positioned above the market — commands a premium.
Active Properties (5)
Active Comparables
| Address | City | Year | BD | BTH | SqFt | LotSz | LP/SqFt | LP | DIM | Score |
|---|---|---|---|---|---|---|---|---|---|---|
| 19350 Sherman | Reseda | 1990 | 2 | 2 | 862 | 82,848 | $464 | $399,900 | 44 | 88 |
| 19350 Sherman Way | Los Angeles | 1990 | 2 | 2 | 849 | 82,848 | $453 | $385,000 | 55 | 87 |
| 19350 Sherman Way | Reseda | 1990 | 2 | 2 | 862 | 82,848 | $435 | $375,000 | 117 | 86 |
| 20134 Leadwell | Winnetka | 1971 | 2 | 2 | 884 | 215,340 | $430 | $380,000 | 271 | 81 |
| 20224 Cohasset Street | Winnetka | 1971 | 2 | 2 | 1,050 | 0 | $405 | $425,000 | 55 | 81 |
| Total: 5 · Average | 2.0 | 2.0 | 901.4 | 115,971 | $437.4 | $392,980 | 108.4 | |||
| Median | 862 | $385,000 | ||||||||
Closed Properties (5)
Closed Comparables
| Address | City | Year | Date | BD | BTH | SqFt | LotSz | LP | SP | SP/SqFt | SP/LP | DIM | Score |
|---|---|---|---|---|---|---|---|---|---|---|---|---|---|
| 19350 Sherman Way | Reseda | 1990 | 07/15/2026 | 2 | 2 | 849 | 82,848 | $379,000 | $380,000 | $448 | 1.00 | 113 | 86 |
| 19431 Sherman Way | Reseda | 1979 | 11/10/2026 | 2 | 2 | 1,058 | 0 | $499,000 | $435,000 | $411 | 0.87 | 70 | 83 |
| 20235 Keswick Street | Winnetka | 1982 | 10/27/2026 | 2 | 2 | 1,021 | 75,704 | $434,900 | $434,900 | $426 | 1.00 | 127 | 82 |
| 20134 Leadwell | Winnetka | 1971 | 06/01/2026 | 2 | 2 | 884 | 215,340 | $374,000 | $374,000 | $423 | 1.00 | 104 | 82 |
| 7515 Winnetka Avenue | Winnetka | 1982 | 07/21/2026 | 2 | 3 | 1,199 | 19,182 | $350,000 | $340,000 | $284 | 0.97 | 50 | 73 |
| Total: 5 · Average | 2.0 | 2.2 | 1,002.2 | 98,268.5 | $392,780 | $392,780 | $398.4 | — | 92.8 | ||||
| Median | 1,021 | $380,000 | $380,000 | ||||||||||
Market Analysis
List vs Sale $/SqFt
Sale Price Trend
Days on Market
Sale vs List Price
This analysis was generated automatically from MLS data. For an in-depth, human-reviewed valuation, contact Joseph Sardella at josephsardella@gmail.com.