1 / 12
73779 Palm Paradise Drive, Palm Desert, CA 92211
$526K2bd · 2ba · 1,375 sqft
Lot 3,901 sqft•HOA $368/mo•Single Family Residence•Active•21d on market•MLS# IV-26108744
73779 Palm Paradise Drive, Palm Desert, CA 92211
MLS# IV-26108744•Residential•Single Family Residence
Active21 days on market
$525,990
2
Beds
2
Baths
1,375
Sq Ft
3,901
Lot Sq Ft
$368
HOA/mo
2026
Year Built
None
View
Property Description
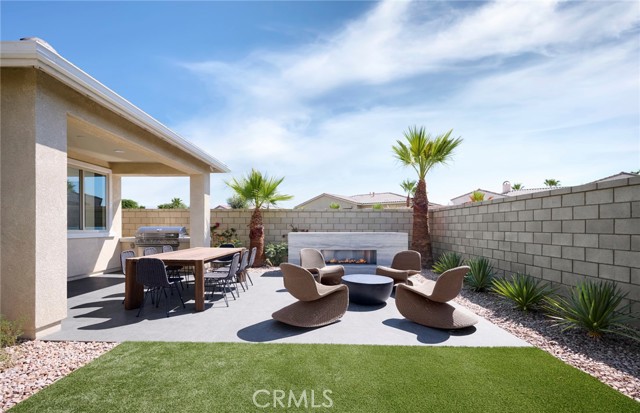
The spacious Kinsey plan, located at Del Webb Explore Palm Desert features 2 beds, 2 baths and so much more, making this your dream floor plan. -Sleek Contemporary exterior elevation -Sinclair White 42" Upper Cabinets -Valentino White Quartz Countertops -Kitchen Aid Appliances -Upgraded LVP Flooring -Built-in Covered Patio
Features & Amenities
FeeBuilt 2026
Property Details
Land Type
Fee
Year Built
2026
Property Type
Residential
Property Subtype
Single Family Residence
Parking Spaces
2
Garage Spaces
2
Cooling
Central Air
View
None
City
Palm Desert
Zip Code
92211
County
Riverside
Mortgage Calculator
Current Rates
$
$
%
Monthly Payment
$2,659.69
Principal & Interest
Loan Amount
$420,792
Total Interest
$536,697
Total Payment Over 30 Years
$957,489
This calculator provides estimates only. Actual mortgage payments may include taxes, insurance, HOA fees, and PMI. Contact a lender for accurate quotes.
Comparative Market Analysis
Affordable Tier · 5 active · 5 closed
73779 Palm Paradise Drive, Palm Desert, CA 92211
Palm Desert · Single Family Residence
$526K
Affordable TierBeds
2
Baths
2
Sqft
1,375
Lot
3,901 sqft
Year
2026
$/Sqft
$383
Pool: Yes✓
View: None✓
Garage: 2-car✓
Listed 3.7% above the median closed sale of $507,000. Price per sqft ($383) is a 10% premium to closed comps ($348).
Price Position
Aligned with the market — fair pricing for the comps.
At market
Subject listed at $526K· $383/sqft
Total list price
Closed comps
vs closed median $507K
+$19K (+3.7%)
Active comps
vs active median $410K
+$116K (+28.3%)
Price per sqft
Closed compsinsufficient comp data
Active comps
vs active avg $/sqft $338
+$45 (+13.4%)
Active Properties (5)
Active Comparables
| Address | City | Year | BD | BTH | SqFt | LotSz | LP/SqFt | LP | DIM | Score |
|---|---|---|---|---|---|---|---|---|---|---|
| 78881 Edgebrook | Palm Desert | 1994 | 2 | 2 | 1,300 | 5,227 | $326 | $424,000 | 39 | 85 |
| 40560 Golden Way | Palm Desert | 1980 | 2 | 2 | 1,248 | 4,792 | $328 | $409,900 | 77 | 84 |
| 78458 Winsford Circle | Palm Desert | 2002 | 2 | 2 | 1,080 | 4,356 | $377 | $407,000 | 3 | 83 |
| 78194 Brookhaven Lane | Palm Desert | 2000 | 2 | 2 | 1,213 | 5,663 | $354 | $429,000 | 33 | 83 |
| 77848 Chandler Way | Palm Desert | 1981 | 2 | 2 | 1,248 | 4,791 | $304 | $379,900 | 92 | 83 |
| Total: 5 · Average | 2.0 | 2.0 | 1,217.8 | 4,965.8 | $337.8 | $409,960 | 48.8 | |||
| Median | 1,248 | $409,900 | ||||||||
Closed Properties (5)
Closed Comparables
| Address | City | Year | Date | BD | BTH | SqFt | LotSz | LP | SP | SP/SqFt | SP/LP | DIM | Score |
|---|---|---|---|---|---|---|---|---|---|---|---|---|---|
| 73757 Palm Paradise Drive | Palm Desert | 2026 | 04/28/2026 | 2 | 2 | 1,324 | 3,901 | $534,990 | $541,572 | $409 | 1.01 | 88 | 98 |
| 73744 Palm Paradise Drive | Palm Desert | 2026 | 05/28/2026 | 2 | 2 | 1,324 | 4,536 | $531,990 | $531,599 | $402 | 1.00 | 118 | 98 |
| 35425 Domani Drive | Palm Desert | 2023 | 06/01/2026 | 3 | 2 | 1,547 | 5,227 | $539,000 | $507,000 | $328 | 0.94 | 151 | 88 |
| 78698 Rockwell Circle | Palm Desert | 2003 | 06/05/2026 | 2 | 2 | 1,172 | 4,792 | $379,000 | $376,000 | $321 | 0.99 | 93 | 85 |
| 78584 Glastonbury Way | Palm Desert | 2002 | 05/29/2026 | 2 | 2 | 1,160 | 4,356 | $330,000 | $322,000 | $278 | 0.98 | 65 | 85 |
| Total: 5 · Average | 2.2 | 2.0 | 1,305.4 | 4,562.4 | $455,634.2 | $455,634.2 | $347.6 | — | 103 | ||||
| Median | 1,324 | $507,000 | $507,000 | ||||||||||
Market Analysis
List vs Sale $/SqFt
Sale Price Trend
Days on Market
Sale vs List Price
AI-generated CMA
This analysis was generated automatically from MLS data. For an in-depth, human-reviewed valuation, contact Joseph Sardella at josephsardella@gmail.com.