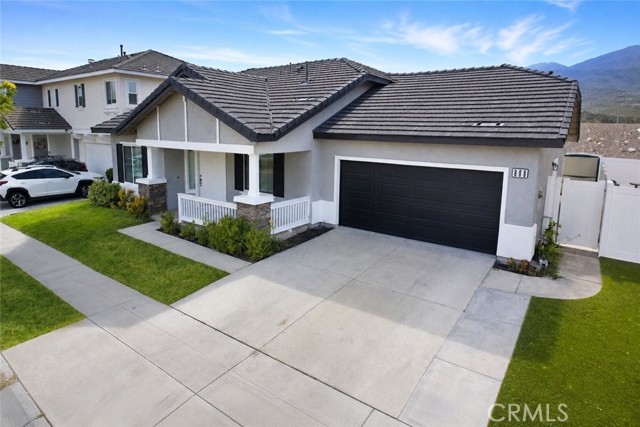
808 Hinckley, Fillmore, CA 93015
808 Hinckley, Fillmore, CA 93015
Property Description
BACK TO THE MARKET due to buyer can't perform. 808 Hinckley Lane, a beautifully reimagined single-story home offering 3 bedrooms, 2 bathrooms, and approximately 1,388 square feet of stylish, move-in-ready living space. Thoughtfully updated throughout, the home features a bright, inviting interior, elegant finishes, contemporary lighting, a beautifully redesigned kitchen with upgraded cabinetry, countertops, and stainless-steel appliances, and tastefully refreshed bathrooms with a clean, modern look. Enjoy the ease of single-level living, an attached garage, no HOA, and no solar lease or solar contract for the buyer to assume. Conveniently located near parks, shopping, dining, and Highway 126.
Features & Amenities
Property Details
Mortgage Calculator
Current Rates
Comparative Market Analysis
Affordable Tier · 5 active · 5 closed
Fillmore · Single Family Residence
Listed 8.0% below the median closed sale of $759,000. Price per sqft ($503) is a 30% premium to closed comps ($388).
Price Position
Priced below the market — value advantage over the field.
Active Properties (5)
Active Comparables
| Address | City | Year | BD | BTH | SqFt | LotSz | LP/SqFt | LP | DIM | Score |
|---|---|---|---|---|---|---|---|---|---|---|
| 113 Surrey | Fillmore | 1980 | 3 | 2 | 1,122 | 1,742 | $575 | $644,900 | 44 | 74 |
| 1134 Shadow Ridge Way | Fillmore | 2026 | 4 | 3 | 1,859 | 5,000 | $390 | $724,990 | 18 | 70 |
| 142 Cherrywood Street | Fillmore | 2013 | 3 | 3 | 1,973 | 1,973 | $354 | $699,000 | 53 | 69 |
| 639 Chapparel Street | Fillmore | 1977 | 4 | 3 | 2,068 | 7,380 | $384 | $795,000 | 28 | 67 |
| 44 Clearwood Street | Fillmore | 2026 | 3 | 3 | 2,327 | 8,630 | $342 | $796,740 | 148 | 52 |
| Total: 5 · Average | 3.4 | 2.8 | 1,869.8 | 4,945 | $409 | $732,126 | 58.2 | |||
| Median | 1,973 | $724,990 | ||||||||
Closed Properties (5)
Closed Comparables
| Address | City | Year | Date | BD | BTH | SqFt | LotSz | LP | SP | SP/SqFt | SP/LP | DIM | Score |
|---|---|---|---|---|---|---|---|---|---|---|---|---|---|
| 936 Hinckley Lane | Fillmore | 2001 | 10/28/2026 | 3 | 3 | 2,114 | 4,356 | $759,000 | $759,000 | $359 | 1.00 | 97 | 83 |
| 1114 1st Street | Fillmore | 1991 | 11/12/2026 | 3 | 3 | 1,866 | 6,185 | $729,000 | $700,000 | $375 | 0.96 | 27 | 79 |
| 1062 Meadowlark Drive | Fillmore | 1992 | 11/24/2025 | 3 | 3 | 1,719 | 5,662 | $715,000 | $705,000 | $410 | 0.99 | 152 | 79 |
| 984 Meadowlark Drive | Fillmore | 1993 | 08/28/2026 | 3 | 3 | 2,071 | 6,148 | $785,000 | $785,000 | $379 | 1.00 | 9 | 77 |
| 1129 1st Street | Fillmore | 1992 | 06/23/2026 | 4 | 2 | 1,893 | 6,490 | $810,000 | $790,000 | $417 | 0.97 | 74 | 76 |
| Total: 5 · Average | 3.2 | 2.8 | 1,932.6 | 5,768.2 | $747,800 | $747,800 | $388 | — | 71.8 | ||||
| Median | 1,893 | $759,000 | $759,000 | ||||||||||
Market Analysis
List vs Sale $/SqFt
Sale Price Trend
Days on Market
Sale vs List Price
This analysis was generated automatically from MLS data. For an in-depth, human-reviewed valuation, contact Joseph Sardella at josephsardella@gmail.com.